Foghorn May 26, 2016 Mtg - Gunnar Carlsson - The Field of Topology
Posted by Editor: FDBobko
The FOGHORN
ROTARY CLUB OF HALF MOON BAY
Article by Bill Johnston
Photos by EJ Dieterle
Program: GUNNAR CARLSSON - Stanford University Professor
Field of Topology
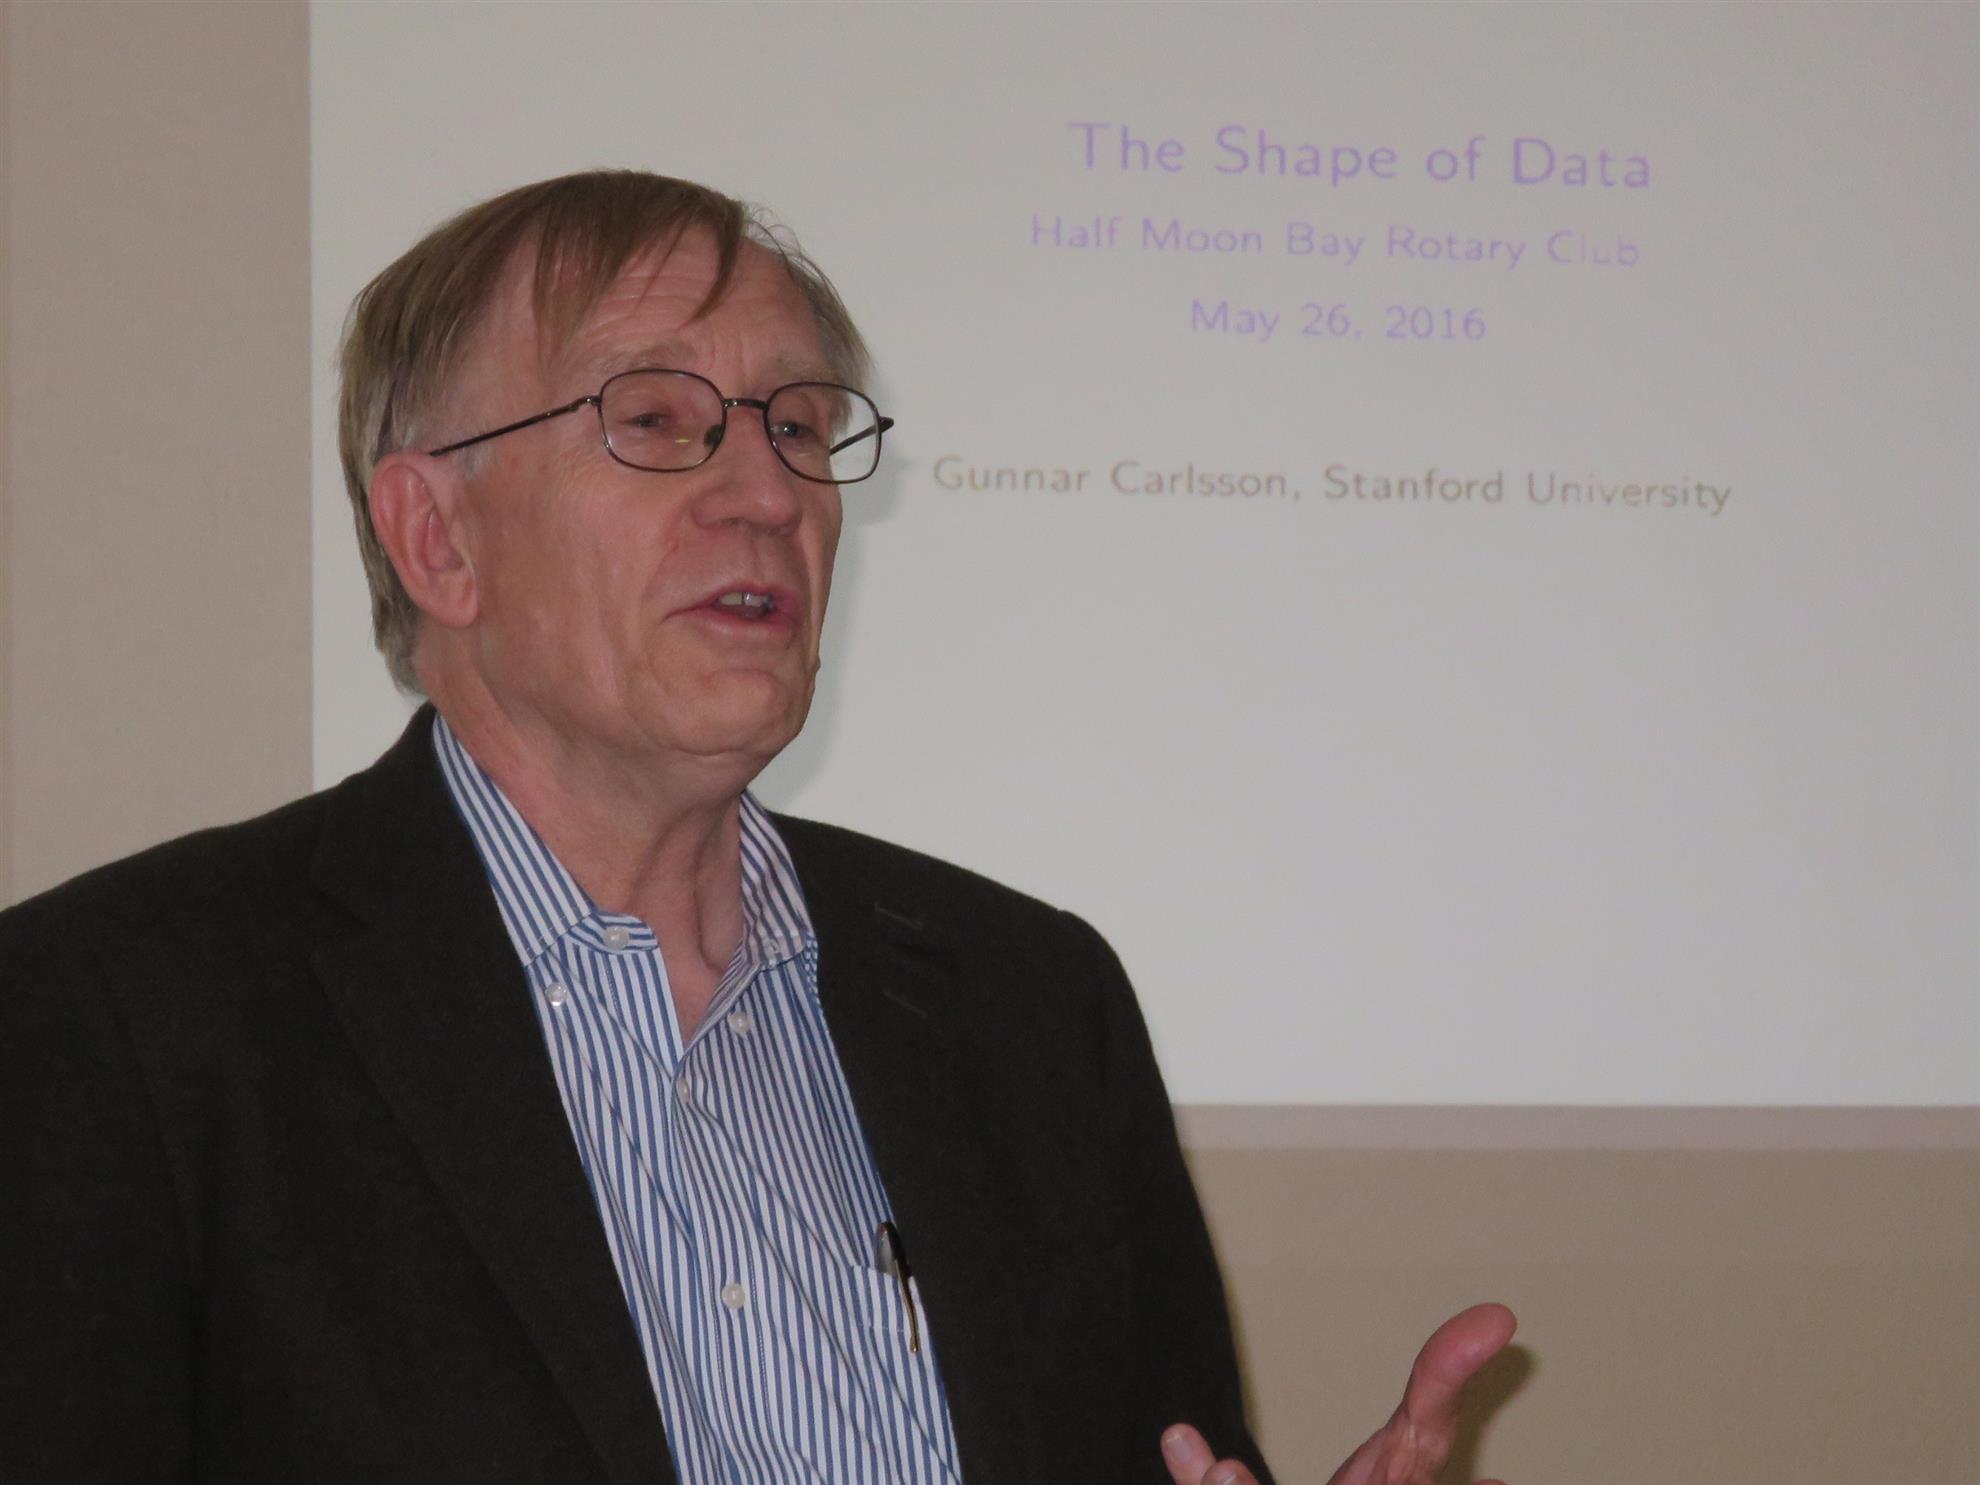
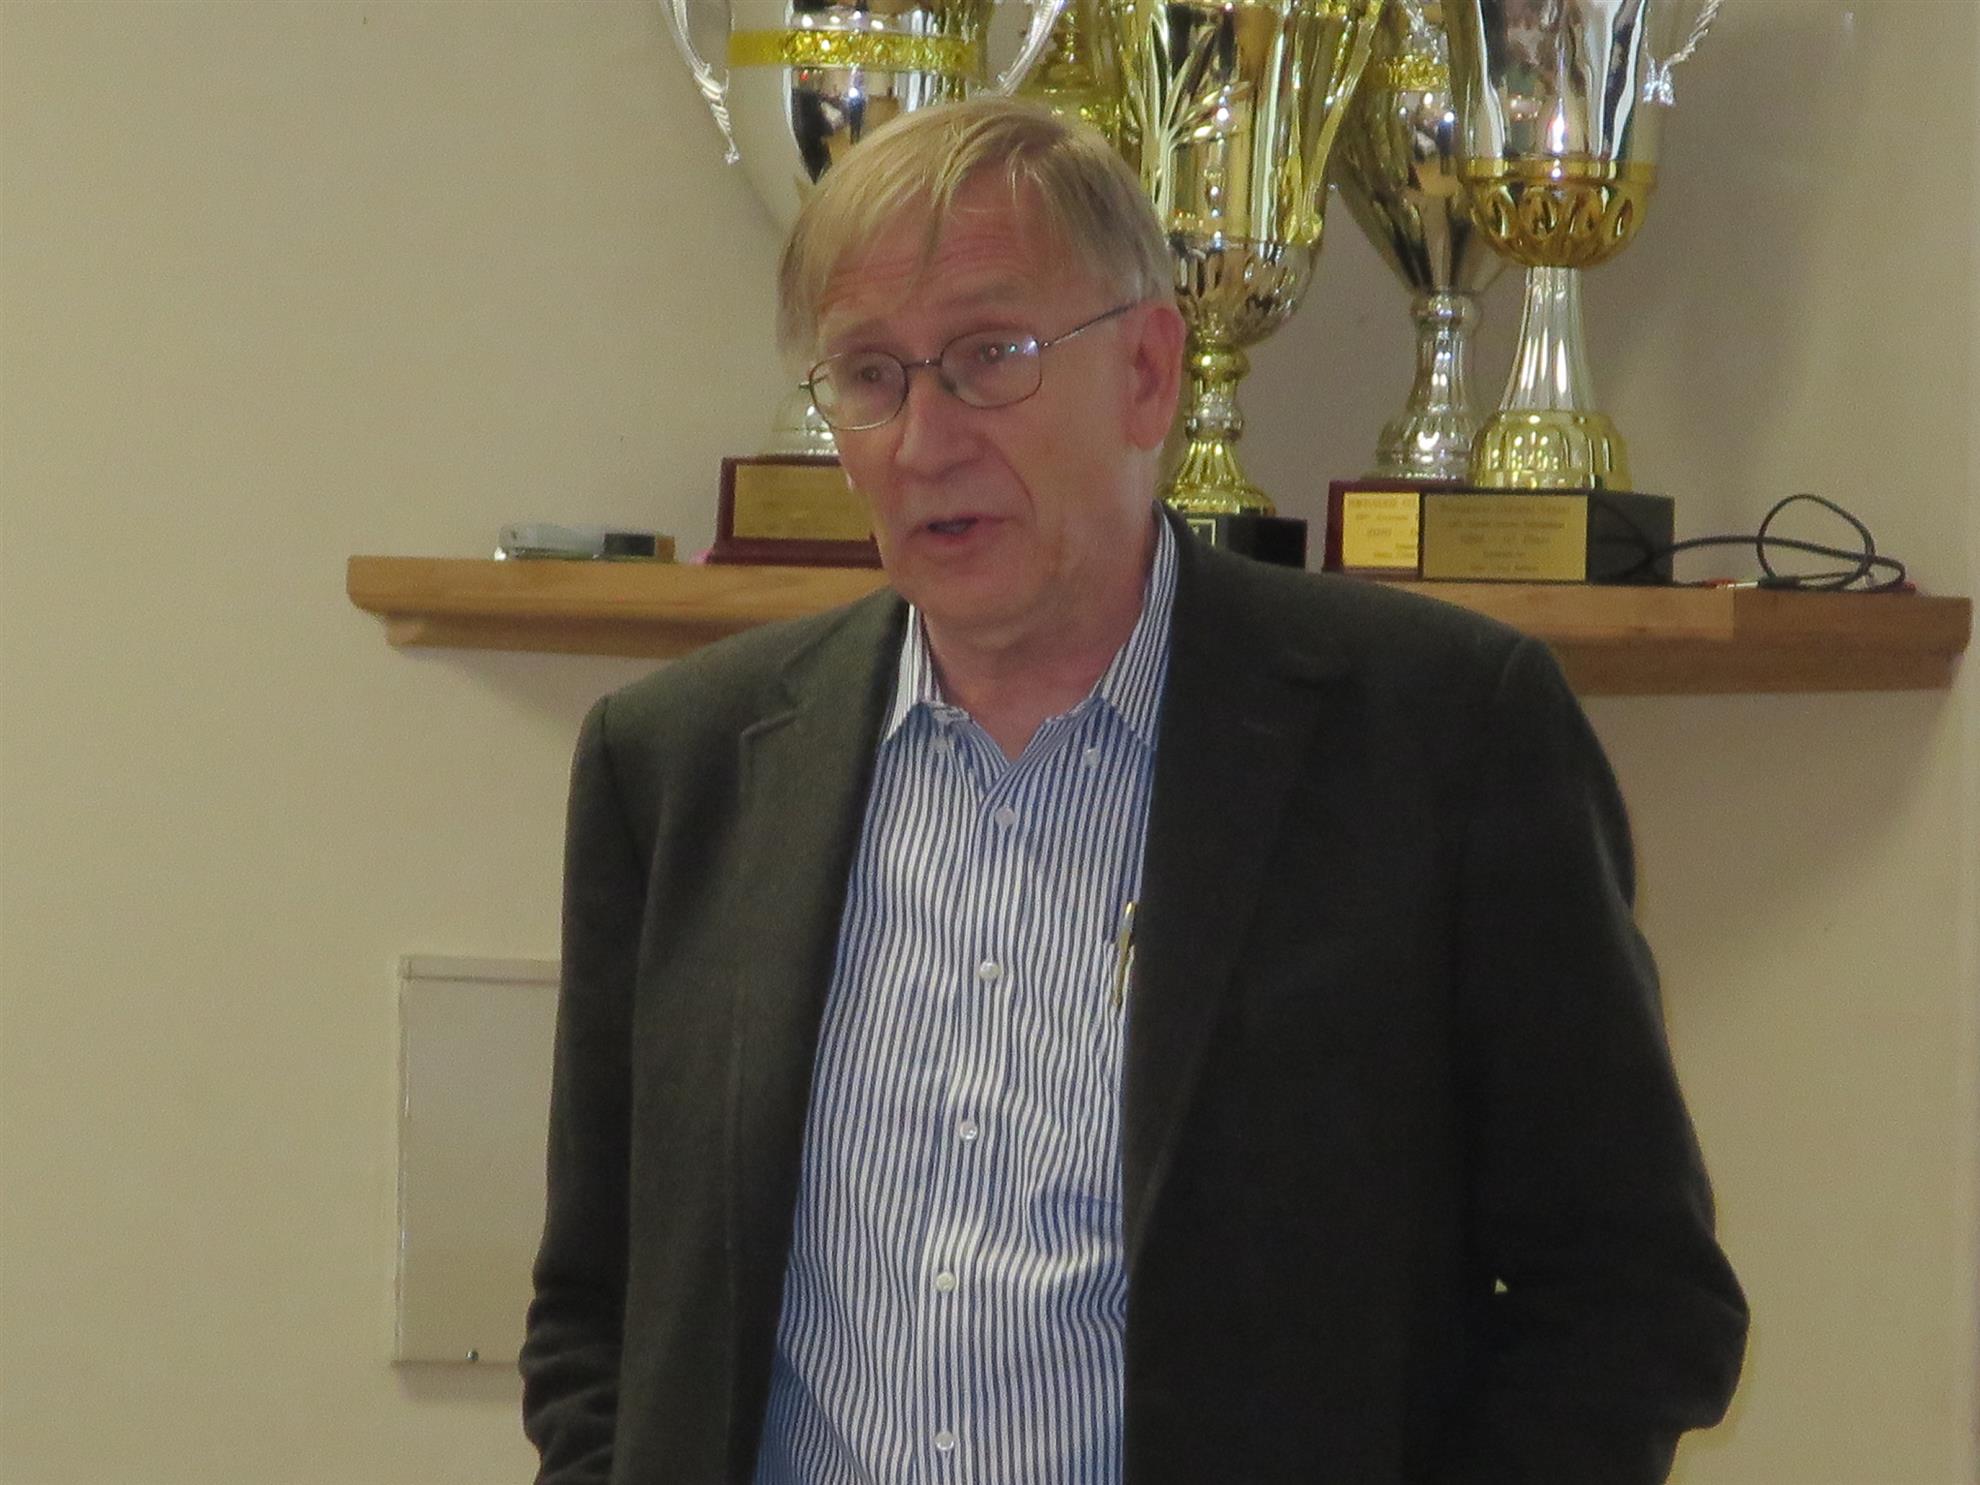
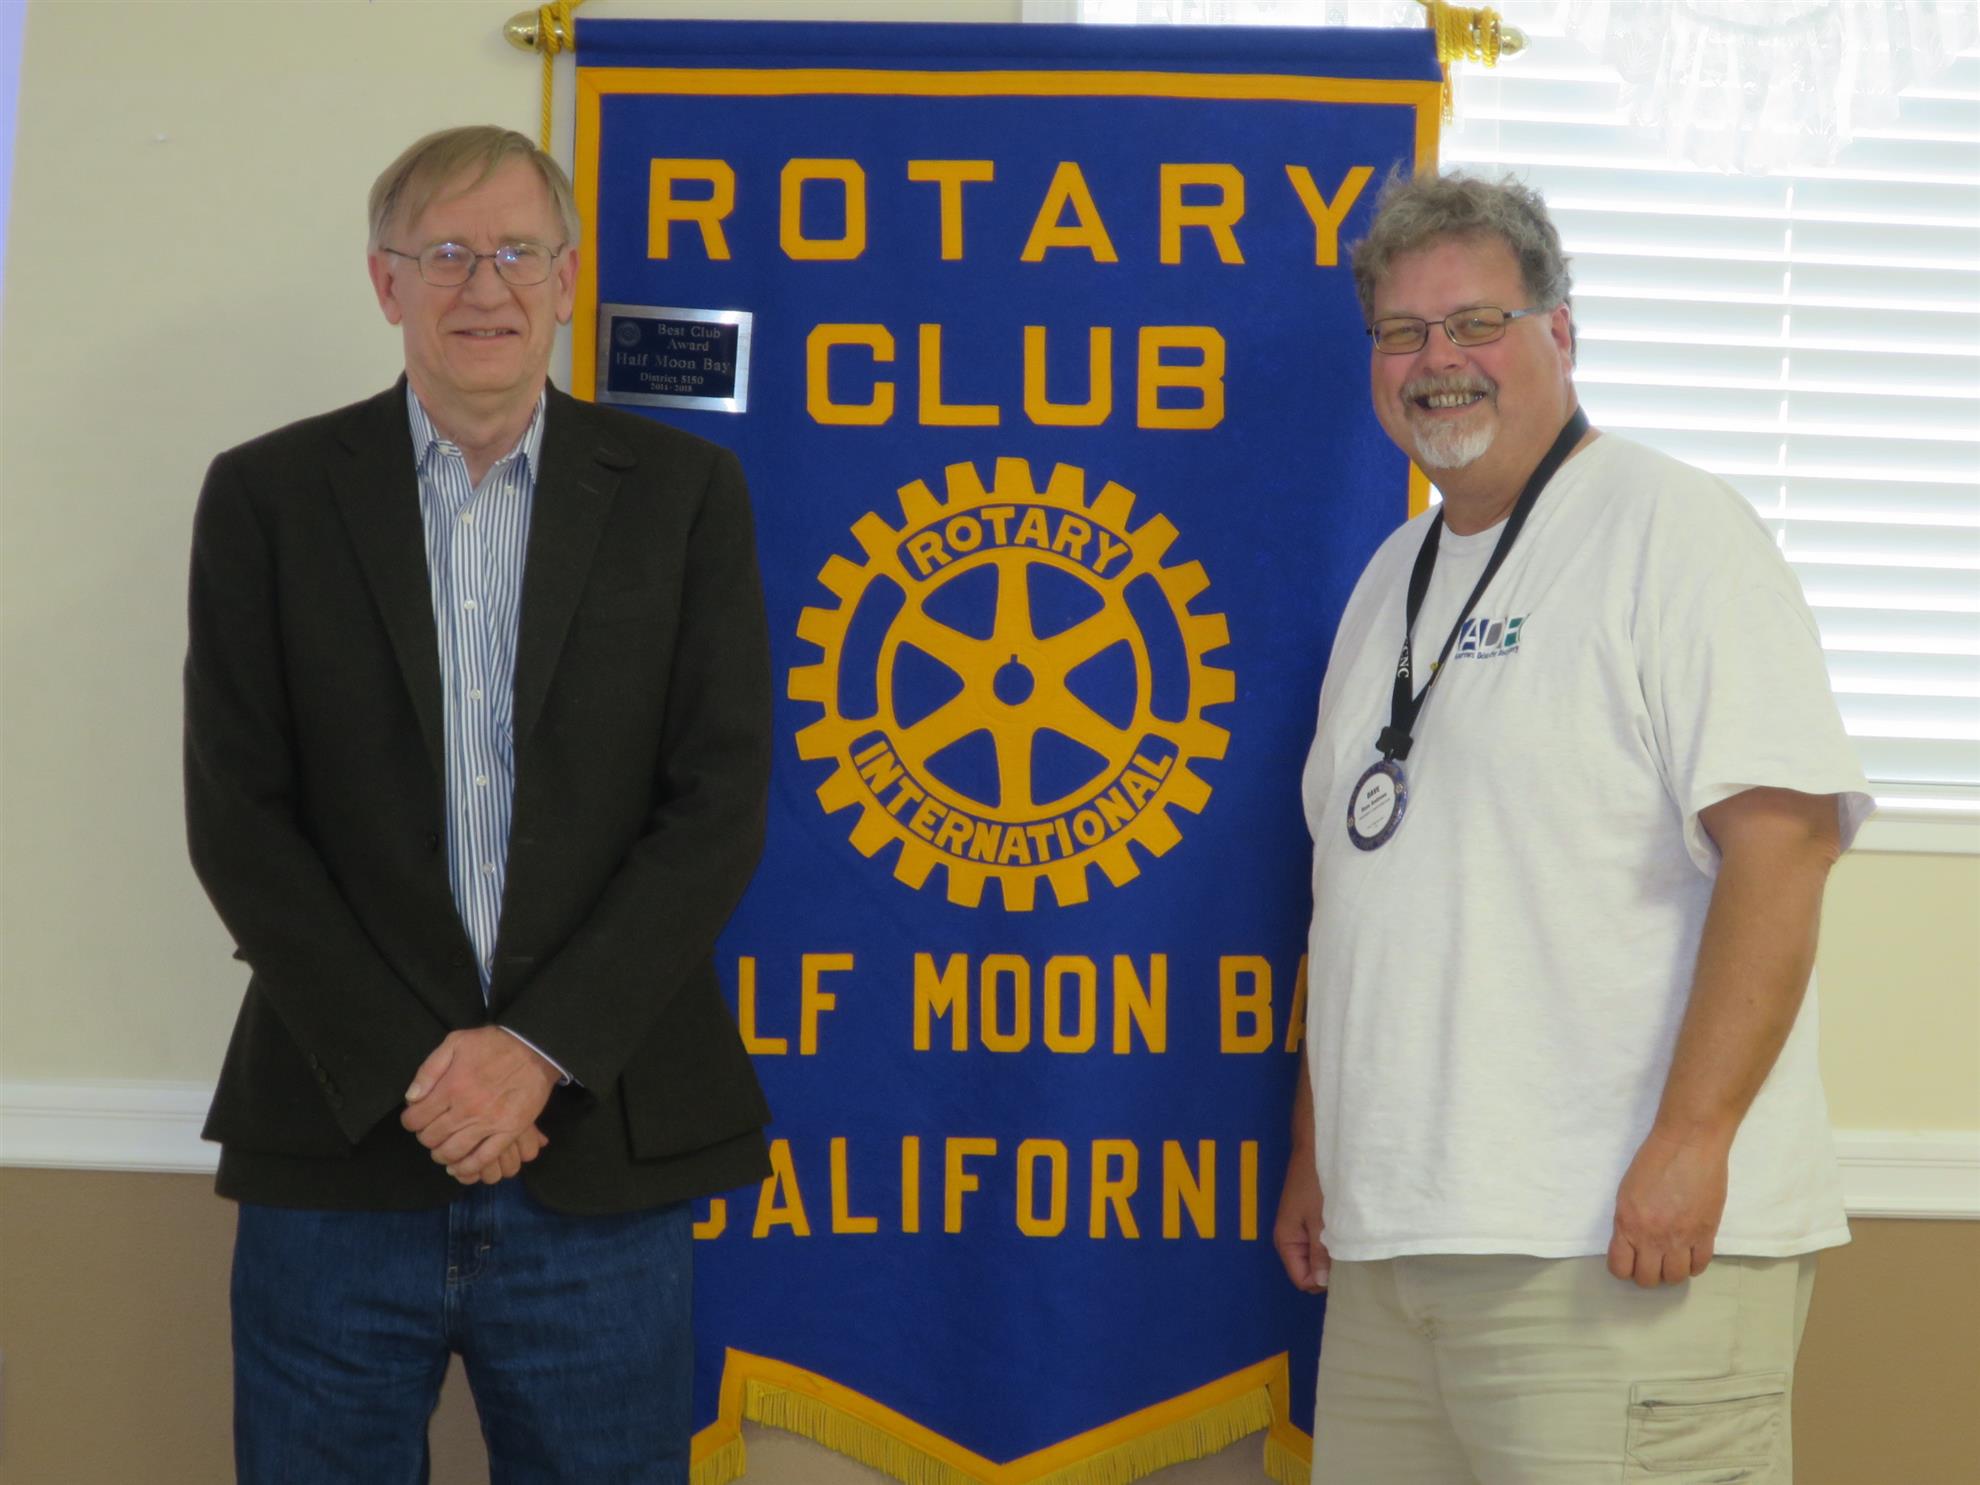
For the second consecutive week Irwin Cohen introduced our speaker as one of the smartest persons in the world. Of course, last week that proved to be comedian Bob Rubin playing the role of the "expert" Artimus Rudder. (While a few among the crowd cottoned on to the con by halftime, Liz Schuck was seen walking out after the meeting still trying to figure out if Artimus was for real.) This week's speaker was Gunnar Carlsson who was introduced as a PhD professor of mathematics from Stanford specializing in the field of topology, the area of mathematics that concerns itself with the study of shape and he specifically works on applications of that area in the analysis of complex data. In other words, he was the kind of guy that has Fibonacci Quarterly and the Journal of Hyperbolic Differential Equations for bathroom reading. (Halfway through the introduction my head was spinning and I noted people were starting to nod off.) Fortunately, the speaker was not nearly as intimidating as the introduction. In fact his presentation was fascinating and he exhibited an unexpected wry humor. Everyone in the room walked out of there a little bit smarter and a little bit more aware of how much we don't know.

Gunnar Carlsson is the founder of the Big Data analytics company, Ayasdi Inc. It is a startup which employs about 100 people and it provides state-of-the-art analysis of complex data by converting the data to topographical representations and then manipulating it in that format. Big Data is not about the size of the data set but rather about how complicated it is. When we talk about molecules, DNA or free text data becomes much more complicated than simple spreadsheets. When the data is converted to shapes it may appear as a regression line, clusters, loops or “Y” junctions. As an example he talked about the Konigsberg Bridges problem. This was a Prussian town with seven bridges and the problem was to devise a solution for crossing each bridge without crossing any of them twice. Using topography the solution becomes much more readily apparent than a pure algebraic approach. He showed us how topography can be used to convert a donut shape into the appearance of a coffee cup and he observed that that was probably not the best way to market his company's services.
At this point in the development of his Corporation he is collaborating with about 300 different academics and allowing them to use the software in their research. This has produced some remarkable results. For example, topographical analysis of data regarding type II diabetes generated a loop form with three clusters one of which was associated with cancer and another with neurological issues. From this analysis of the data they were able to conclude that there are actually three different types of type II diabetes. In another study regarding the progression of infectious disease they again discovered a loop form with checkpoints that occurred in the context of the transition from well to sick too well again. This provides the researchers with better information regarding function. Still another economic study looked at the economy over the last 40 years and again found a loop pattern with distinct outlier data representing the years 2007 – 2008. Analyzing the data of a study involving Han Chinese, Ibo tribesmen from Nigeria and Caucasians from northern Utah they found that with the exception of the Han Chinese the data was stellate. The Han Chinese had a central node form. Further analysis led to the discovery that the data was compromised because the Chinese data had been preprocessed to eliminate duplicate related persons in contrast to the data from the other populations. This issue with the research was discovered by viewing the shape of the data.
Topography is a new kind of data modeling. Data shaping involves viewing anomalies, functionality over time and sequencing.
Gunnar Carlsson showed us data slides from a World Values Survey. This is a survey which used 2000 respondents in a whole bunch of countries. Participants were asked questions that included trust in institutions. There were numerous other questions designed to obtain characteristics of the respondents. When the data was converted to shape it produced a loop shape. Correlating additional factors with the data and using color to define the additional factors produced lines of data. For example, coding by liberal versus conservative produced a Northwest - South East line of data and coloring by establishment versus nonestablishment produced in Northeast - Southwest line of data. If you looked at the degree to which people believe they had control over their lives you found a north-south line of data and if you looked at attitudes regarding immigration or faith in the United Nations you found an east-west line of data. In other words, by reducing the data to a shape and color coding it, the researchers were easily able to see patterns that might not otherwise have been apparent.
Bottom line is that this stuff was really cool and still way above my head.
At this point in the development of his Corporation he is collaborating with about 300 different academics and allowing them to use the software in their research. This has produced some remarkable results. For example, topographical analysis of data regarding type II diabetes generated a loop form with three clusters one of which was associated with cancer and another with neurological issues. From this analysis of the data they were able to conclude that there are actually three different types of type II diabetes. In another study regarding the progression of infectious disease they again discovered a loop form with checkpoints that occurred in the context of the transition from well to sick too well again. This provides the researchers with better information regarding function. Still another economic study looked at the economy over the last 40 years and again found a loop pattern with distinct outlier data representing the years 2007 – 2008. Analyzing the data of a study involving Han Chinese, Ibo tribesmen from Nigeria and Caucasians from northern Utah they found that with the exception of the Han Chinese the data was stellate. The Han Chinese had a central node form. Further analysis led to the discovery that the data was compromised because the Chinese data had been preprocessed to eliminate duplicate related persons in contrast to the data from the other populations. This issue with the research was discovered by viewing the shape of the data.
Topography is a new kind of data modeling. Data shaping involves viewing anomalies, functionality over time and sequencing.
Gunnar Carlsson showed us data slides from a World Values Survey. This is a survey which used 2000 respondents in a whole bunch of countries. Participants were asked questions that included trust in institutions. There were numerous other questions designed to obtain characteristics of the respondents. When the data was converted to shape it produced a loop shape. Correlating additional factors with the data and using color to define the additional factors produced lines of data. For example, coding by liberal versus conservative produced a Northwest - South East line of data and coloring by establishment versus nonestablishment produced in Northeast - Southwest line of data. If you looked at the degree to which people believe they had control over their lives you found a north-south line of data and if you looked at attitudes regarding immigration or faith in the United Nations you found an east-west line of data. In other words, by reducing the data to a shape and color coding it, the researchers were easily able to see patterns that might not otherwise have been apparent.
Bottom line is that this stuff was really cool and still way above my head.
May 26, 2016 Meeting Recap
Article by Dianne Bobko
Photos by EJ Dieterle
Greeters
.JPG)
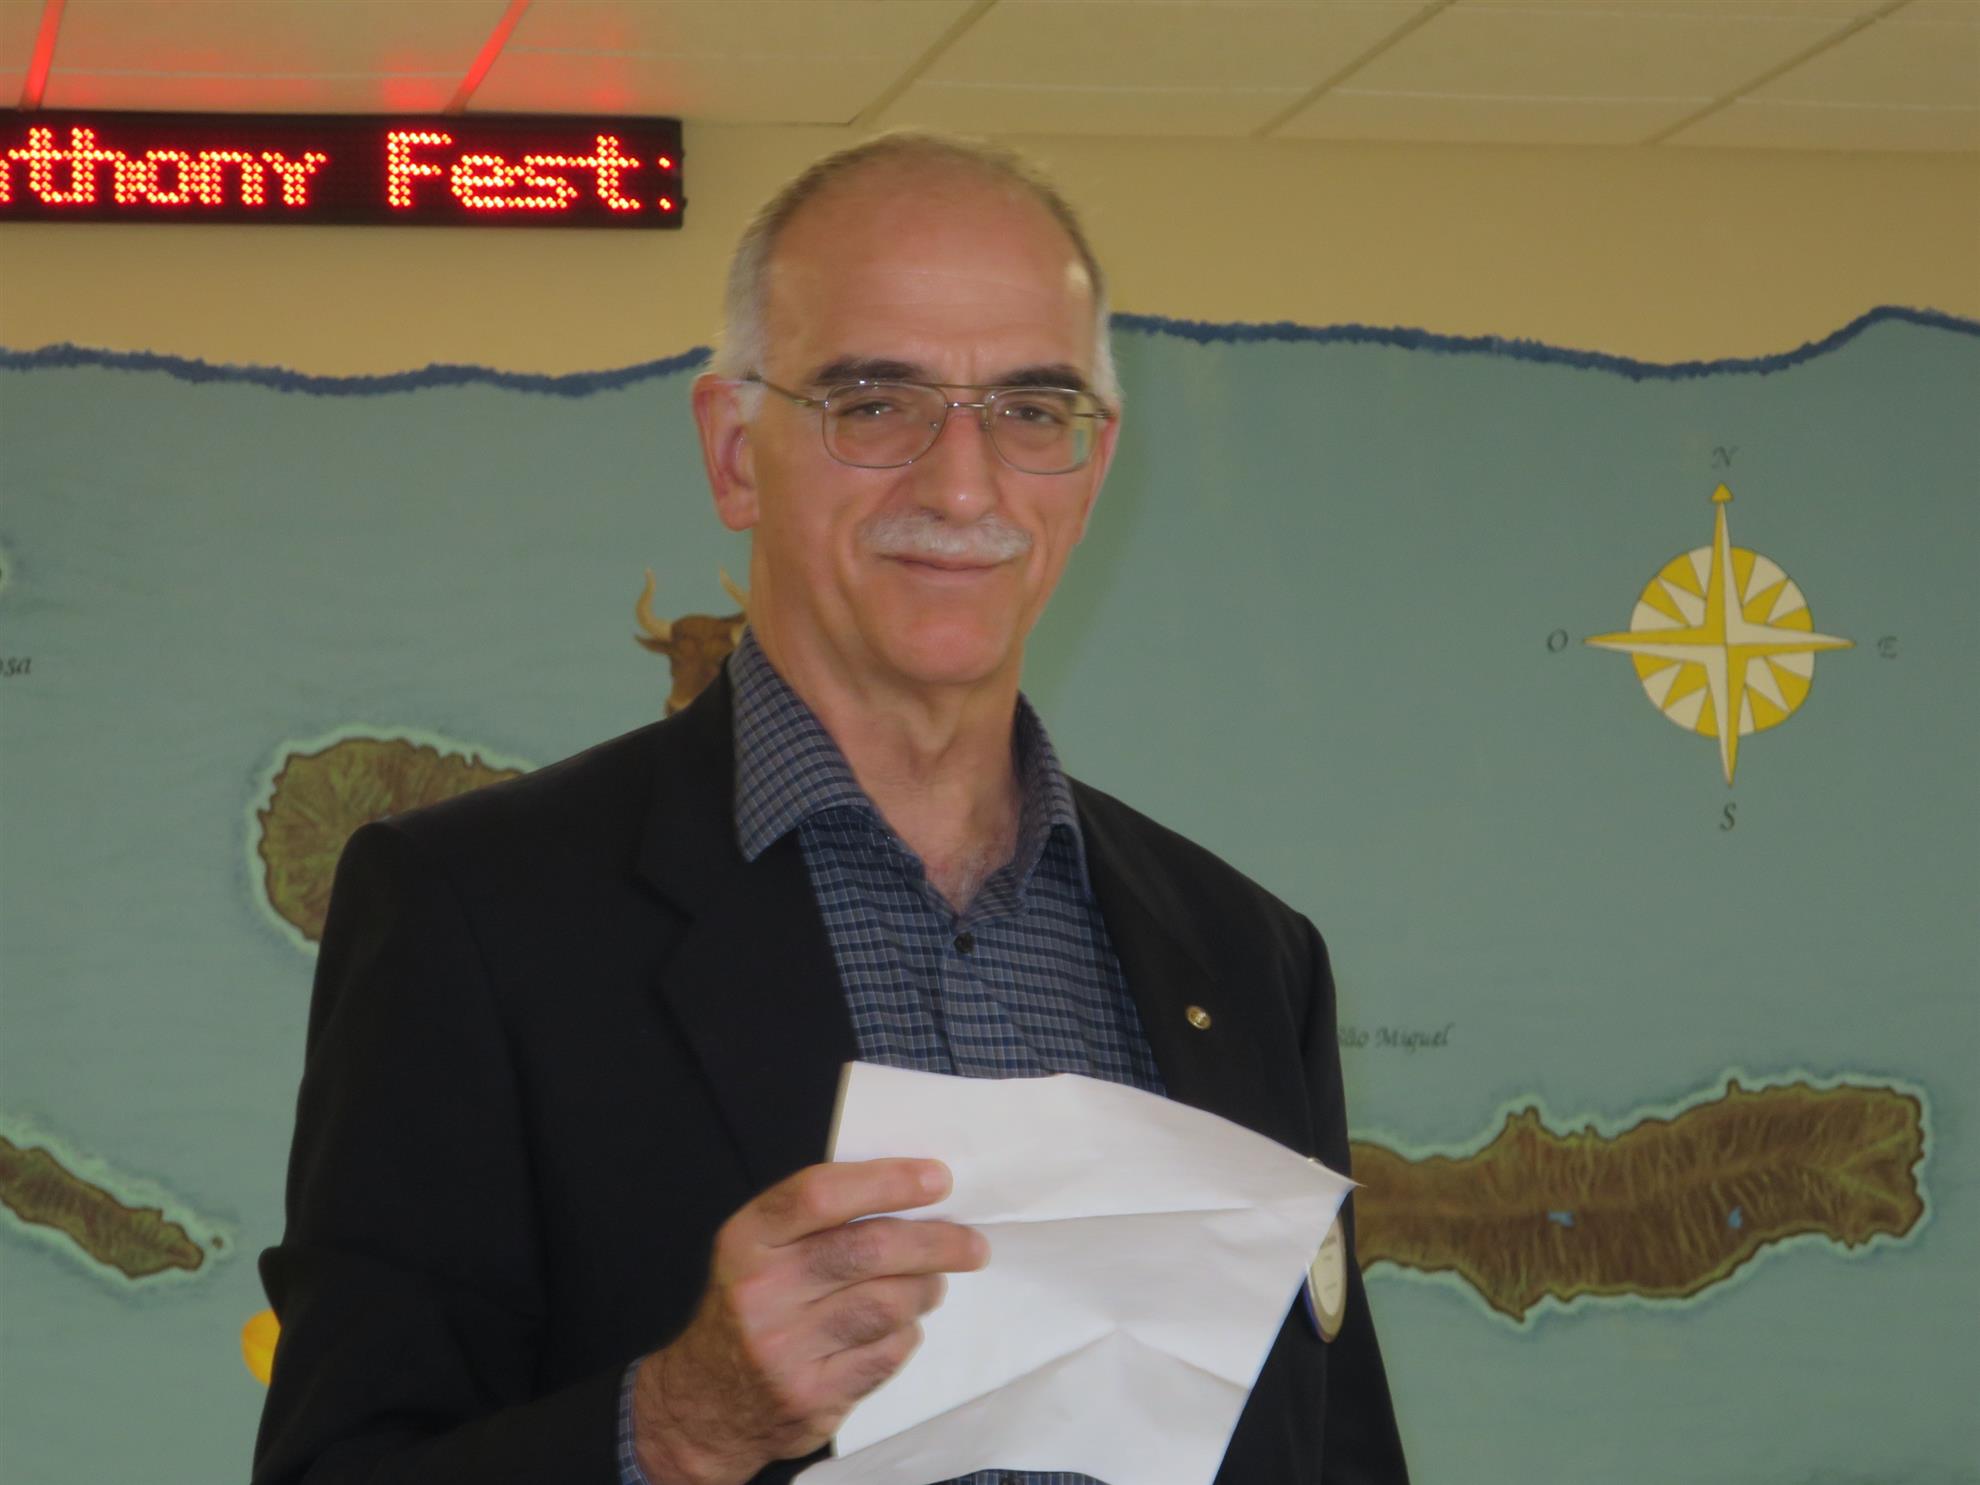
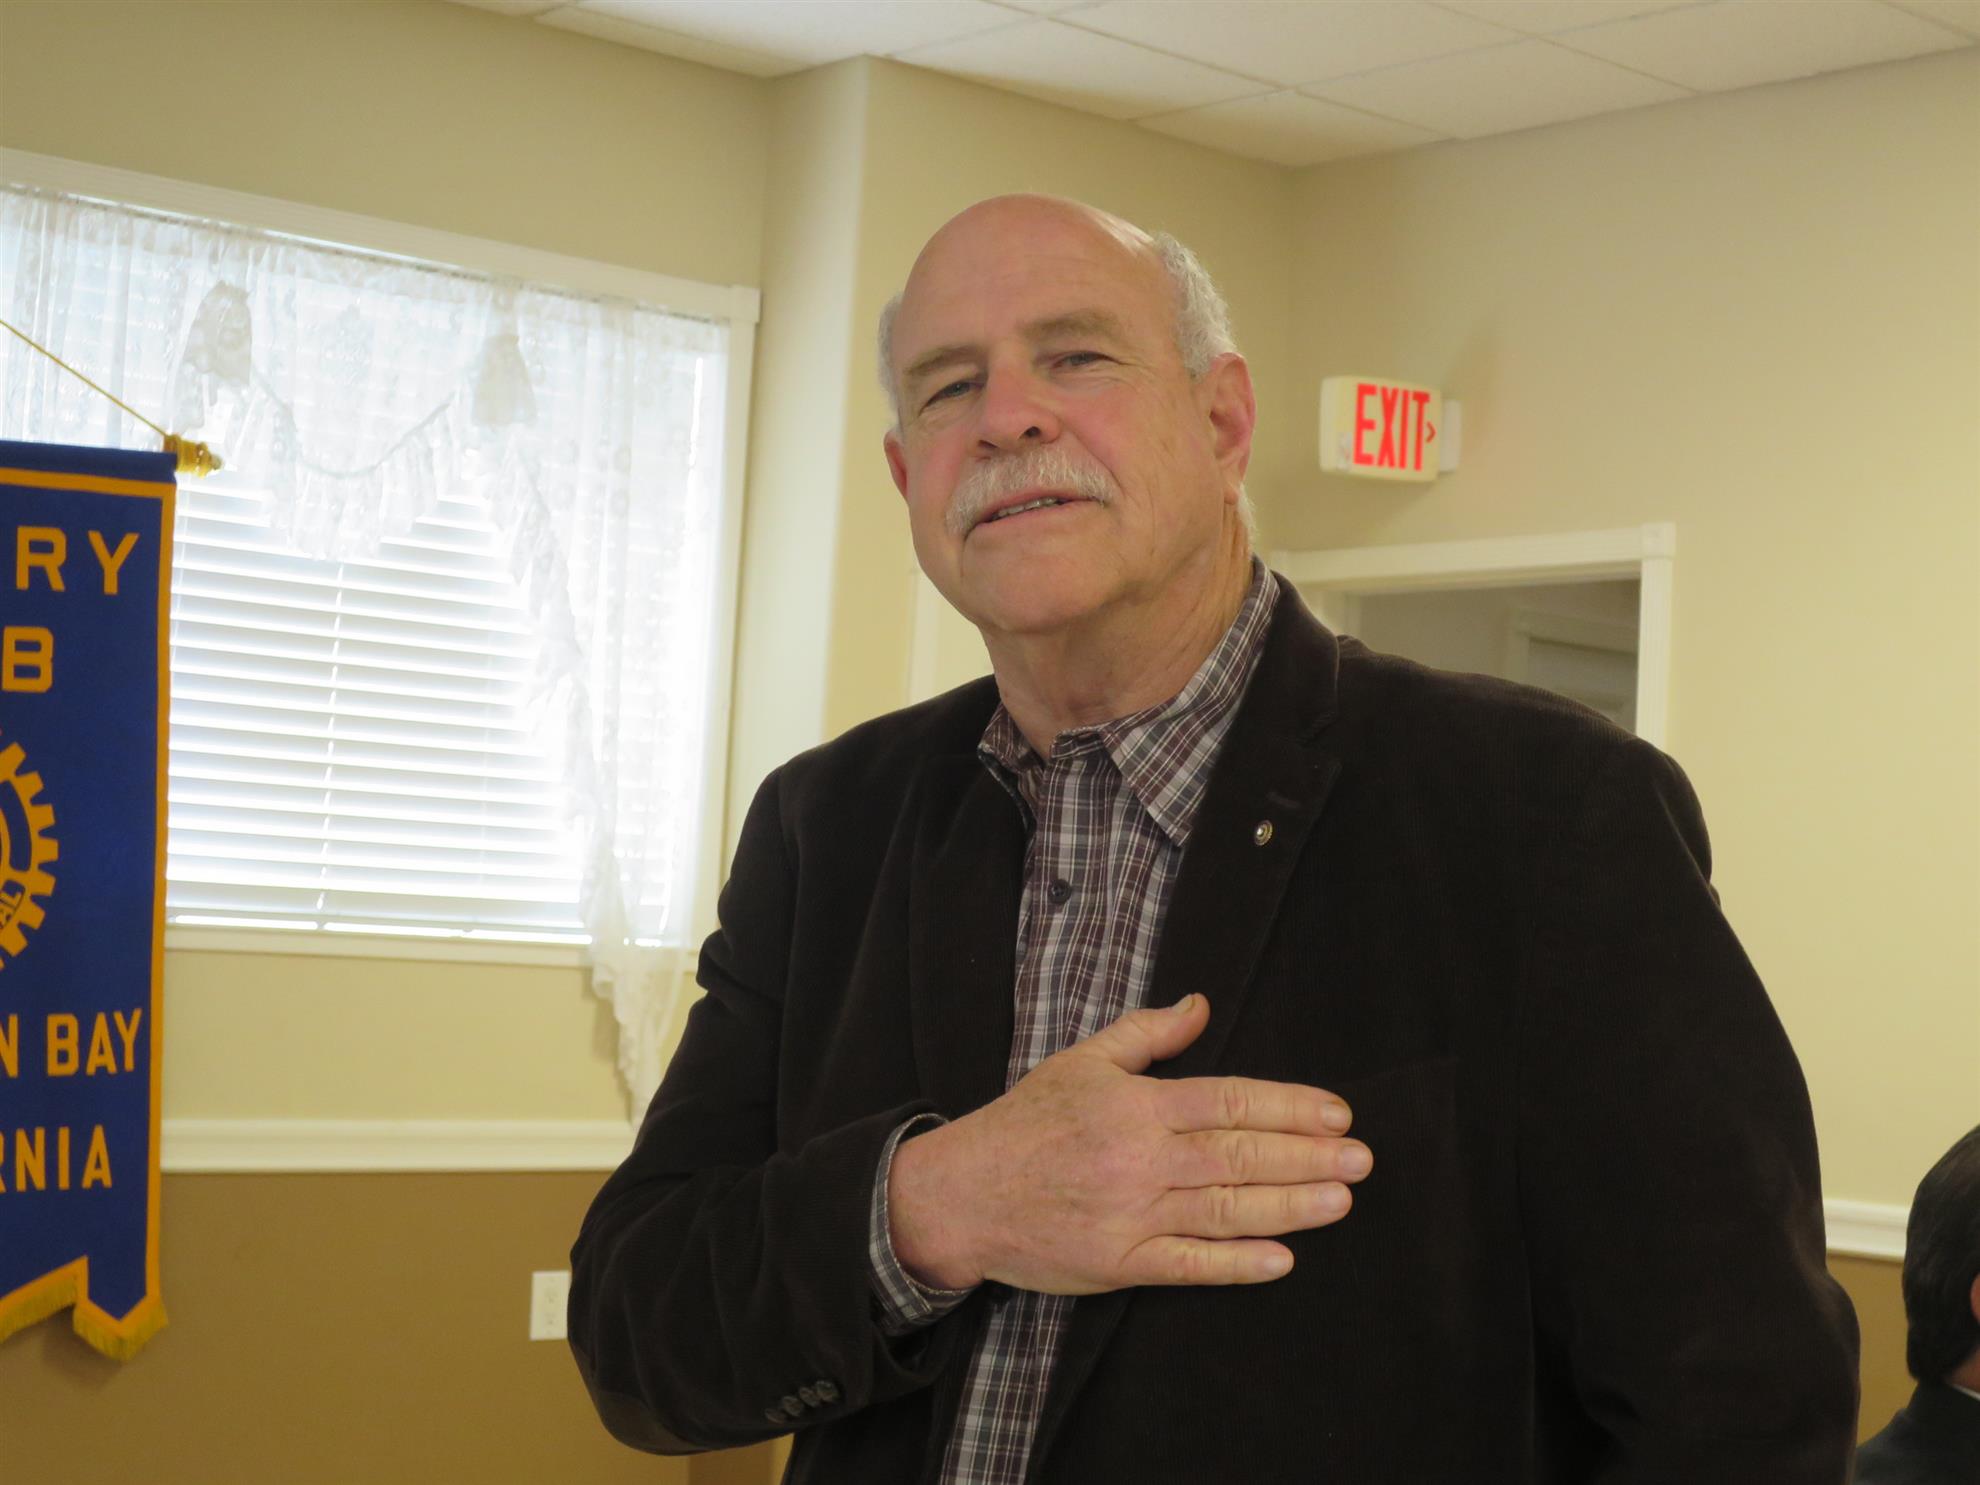
This week PP Dianne Bobko joined Ed Daniels in greeting members. Ed read some Inspirations Thoughts to start us off after the Pledge of Allegiance led by Irwin Cohen.
Visitors
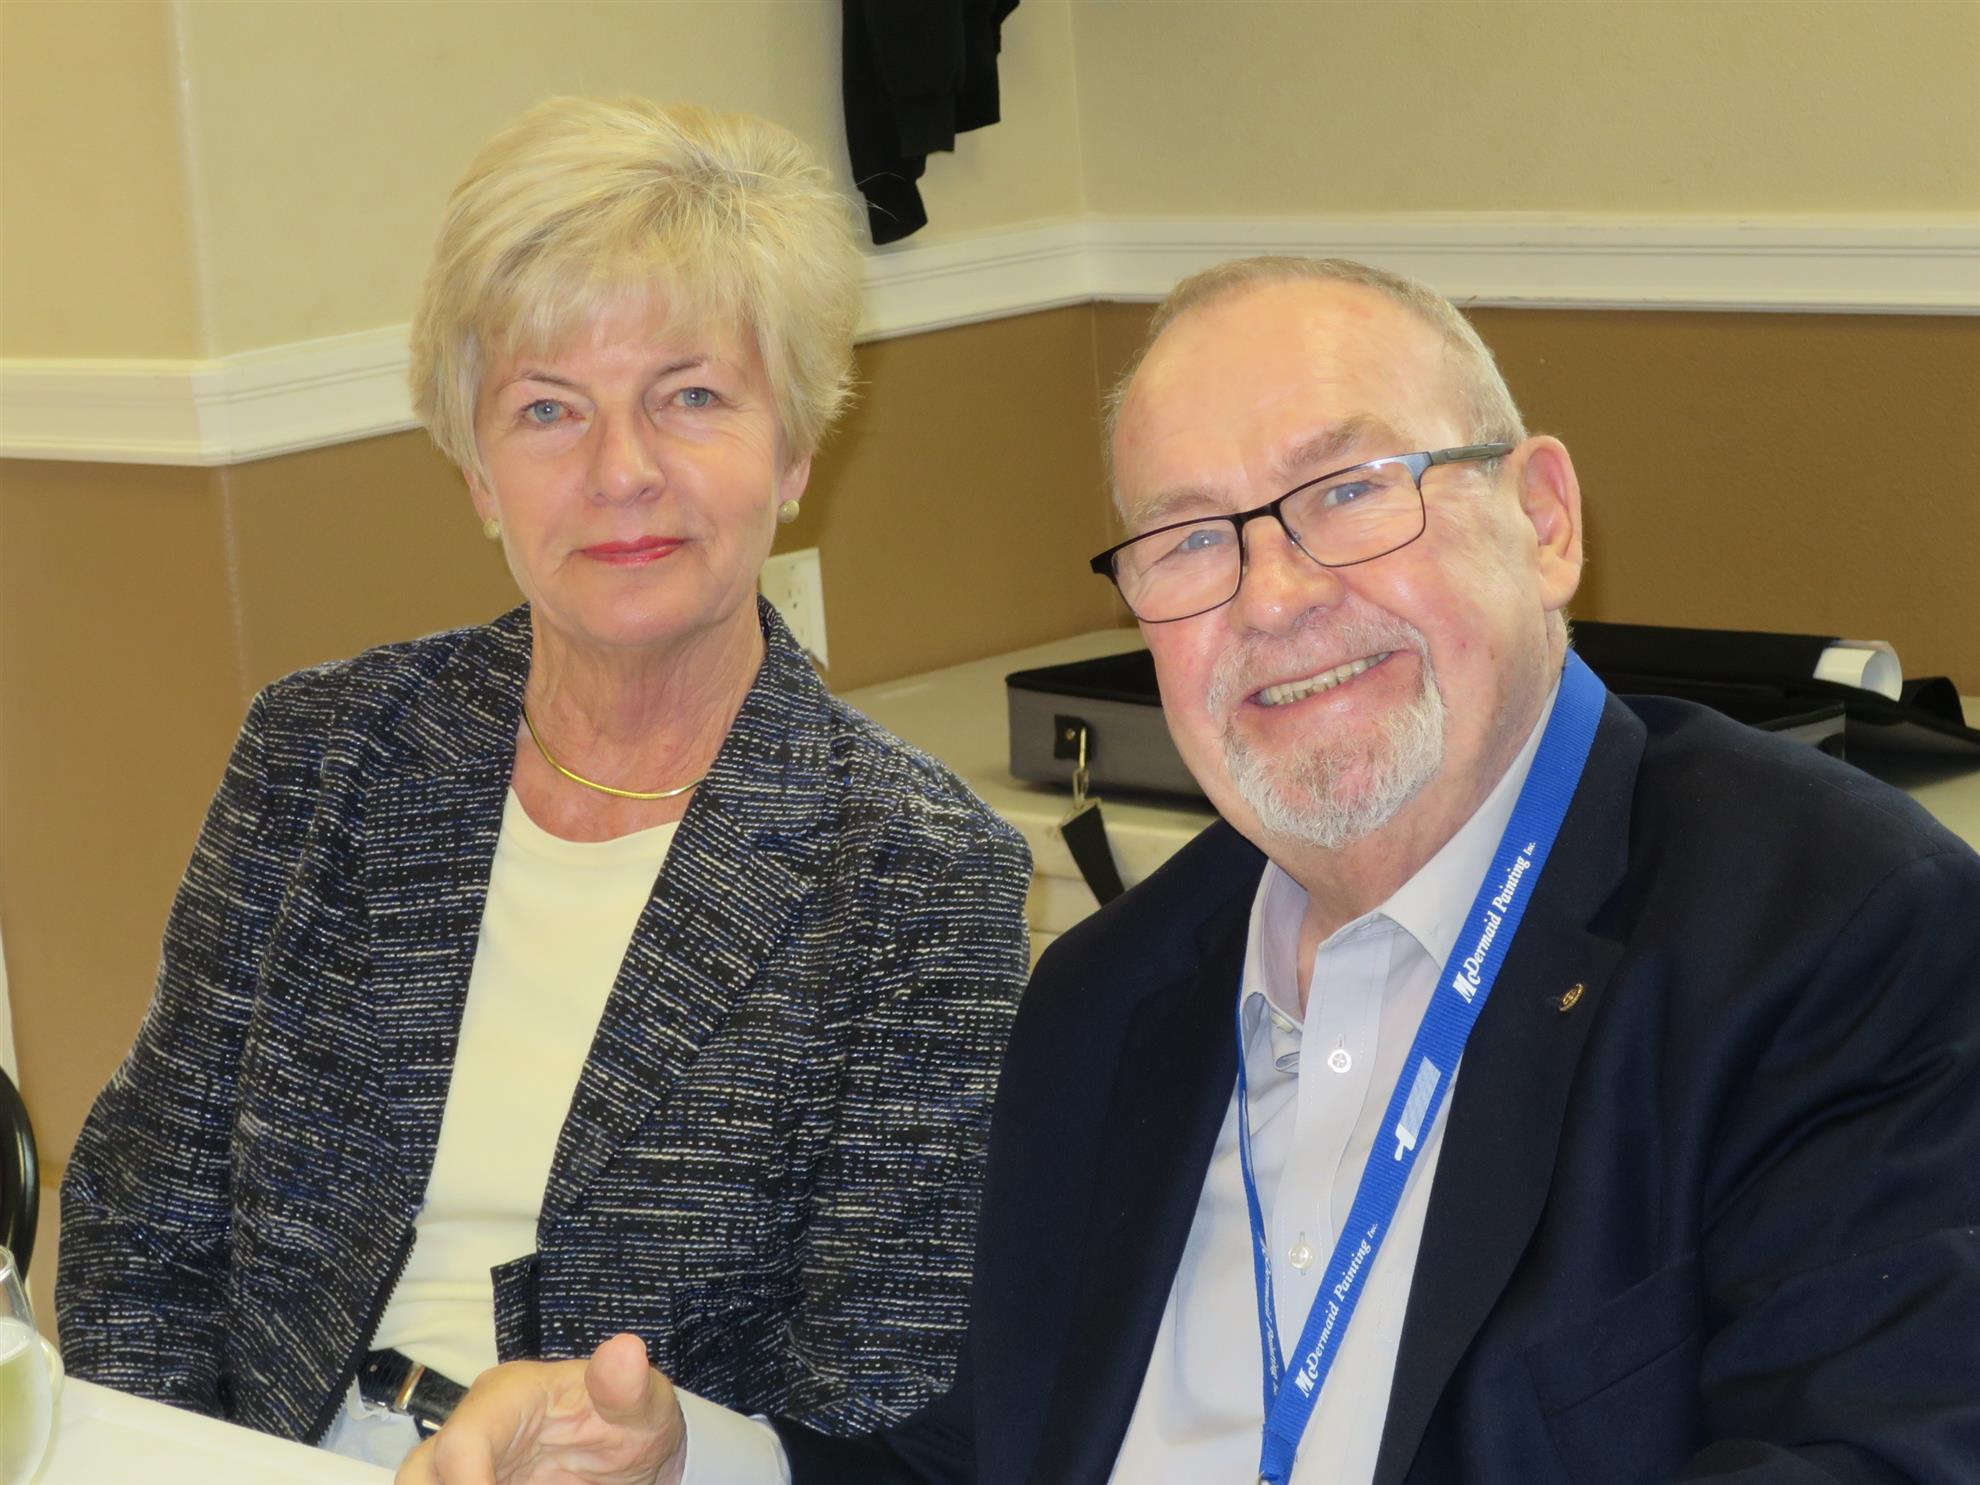
Freda Jeffs joined Robin for our meeting.
Happy/Crappy
Teresa Adam shared that one of her employees has been promoted  and is leaving
  . And she has 2 part-time jobs available!
  Linda Crose Anderson has put her house on Market has moved to HMB. The price has been drastically reduced.
and is leaving . And she has 2 part-time jobs available! Linda Crose Anderson has put her house on Market has moved to HMB. The price has been drastically reduced.Liz Schuck announced that the gross revenue from Magic of the Coastside 2016 was $48,594.60 with a NET of $28,400.00 An INCREASE of $13K over 2015. Fantastic!!!! Congrats to all who worked so hard to make this so successful!!!
Fantastic!!!! Congrats to all who worked so hard to make this so successful!!!Rose Serdy thanked everyone for lovely card and warm messages during her recovery from full hip replacement just 3 weeks ago. It was great to see her back already! She said she has now joined KO'Brian club of new Hippers. It was an interestering surgery andwent very well. Recovery has been a little hare, but the followup therapy and care has been wonderful
Dave Dickson missed last couple meetigs. Thanks to Ginger, who planned the wonderful Rhine River cruise, the Dicksons joined a group from club on this fun trip. Ginger Minoletti (she and Paul were also on the trip) mentioned there was a strike at one of the airports in Paris that she has been working about since some clients are there and on their way back. She mentioned how much they had enjoyed the stop in Amsterdam, The Hague and, at the end of the river trip, 3 days/nights in Berlin. It was a lot of fun.
John Evans mentioned that the scholarships were awarded from the money raised by the HS students at their Spin Art Booth at the PF. He also recounted the trip he took on the train from Oakland to downtown SF and happening to go by the new Apple Store at Union Square on OPENING DAY. The crowds were huge. People had waiting in line all night to get in. There was a band from Nashville! The building is spectacular, and he recommends going to see it.
BONUS QUESTION(from Dianne): What was the name of the Satellite Bo Bobko launched on his first Space Mission (STS 6), and what was it's function.
Dave Dickson missed last couple meetigs. Thanks to Ginger, who planned the wonderful Rhine River cruise, the Dicksons joined a group from club on this fun trip. Ginger Minoletti (she and Paul were also on the trip) mentioned there was a strike at one of the airports in Paris that she has been working about since some clients are there and on their way back. She mentioned how much they had enjoyed the stop in Amsterdam, The Hague and, at the end of the river trip, 3 days/nights in Berlin. It was a lot of fun.
John Evans mentioned that the scholarships were awarded from the money raised by the HS students at their Spin Art Booth at the PF. He also recounted the trip he took on the train from Oakland to downtown SF and happening to go by the new Apple Store at Union Square on OPENING DAY. The crowds were huge. People had waiting in line all night to get in. There was a band from Nashville! The building is spectacular, and he recommends going to see it.
Announcements
Pres Dave announced that volunteers are needed to help with Grad Night at the HS on June 9th. They are 35 people short. Information on how to sign up was in the FogHorn email send this week. If you are interesting in helping, find the email.
Also in the ForHorn email is information on registering for the RI 2017 Convention which will be in Atlanta. Early registration saves you $$$
Lix Schuck recognized Robin Jeffs and Ralph Ely for having served on our Foundation Board for many years. Their terms are expiring, so anyone interested in being considered to replace them should let Liz or Dave know.
Dave’s Quiz of the Week - on Satellites! Dave said his favorite song was by the Tornados and came out in '62 What is the Song?
Also in the ForHorn email is information on registering for the RI 2017 Convention which will be in Atlanta. Early registration saves you $$$
Lix Schuck recognized Robin Jeffs and Ralph Ely for having served on our Foundation Board for many years. Their terms are expiring, so anyone interested in being considered to replace them should let Liz or Dave know.
Dave’s Quiz of the Week - on Satellites! Dave said his favorite song was by the Tornados and came out in '62 What is the Song?
- What is the satellite the tune is named for and what was its function?
- Telstar. Launched in 1962 it was a communications satellite built by Bell Labs and AT&T. It relays television, telephone and fax signals and provided the first live feed TV from Europe. Telstar 18 is currently in operation.
- What was the name of the first man-made satellite and what year was it launched?
- Sputnik 1 1957
- What was the name of the first American satellite?
- Vanguard TV3 which failed in 1957. Explorer 1 was successfully launched in 1958 (also known as grapefruitnik)
- What is the name of the oldest man-launched satellite in space?
- Vanguard 1 launched in 1958. Expected to stay in orbit until 2200
- What was the first satellite launched by NASA?
- Pioneer 1 launched in October 1958
- What was the first man-made object on the moon?
- Luna 2 launched by the USSR on Sept. 12, 1959
- What are GPS satellites and how do they work?
- Global Positioning satellites occupy a KNOW place in orbit. Ground receivers triangulate between the satellites for a position and altitude on the ground
- What are the Key Hole satellites?
BONUS QUESTION(from Dianne): What was the name of the Satellite Bo Bobko launched on his first Space Mission (STS 6), and what was it's function.
Answer: TDRS (tracking and data relay satellite) which is a type of communications satellite that forms part of the Tracking and Data Relay Satellite System (TDRSS) used by NASA and other United States government agencies for communications to and from independent "User Platforms" such as satellites, balloons, aircraft, and the International Space Station. This system was designed to replace an existing worldwide network of ground stations that had supported all of NASA's manned flight missions and unmanned satellites in low-Earth orbits.
The MARBLE DRAW -no marble winners this week
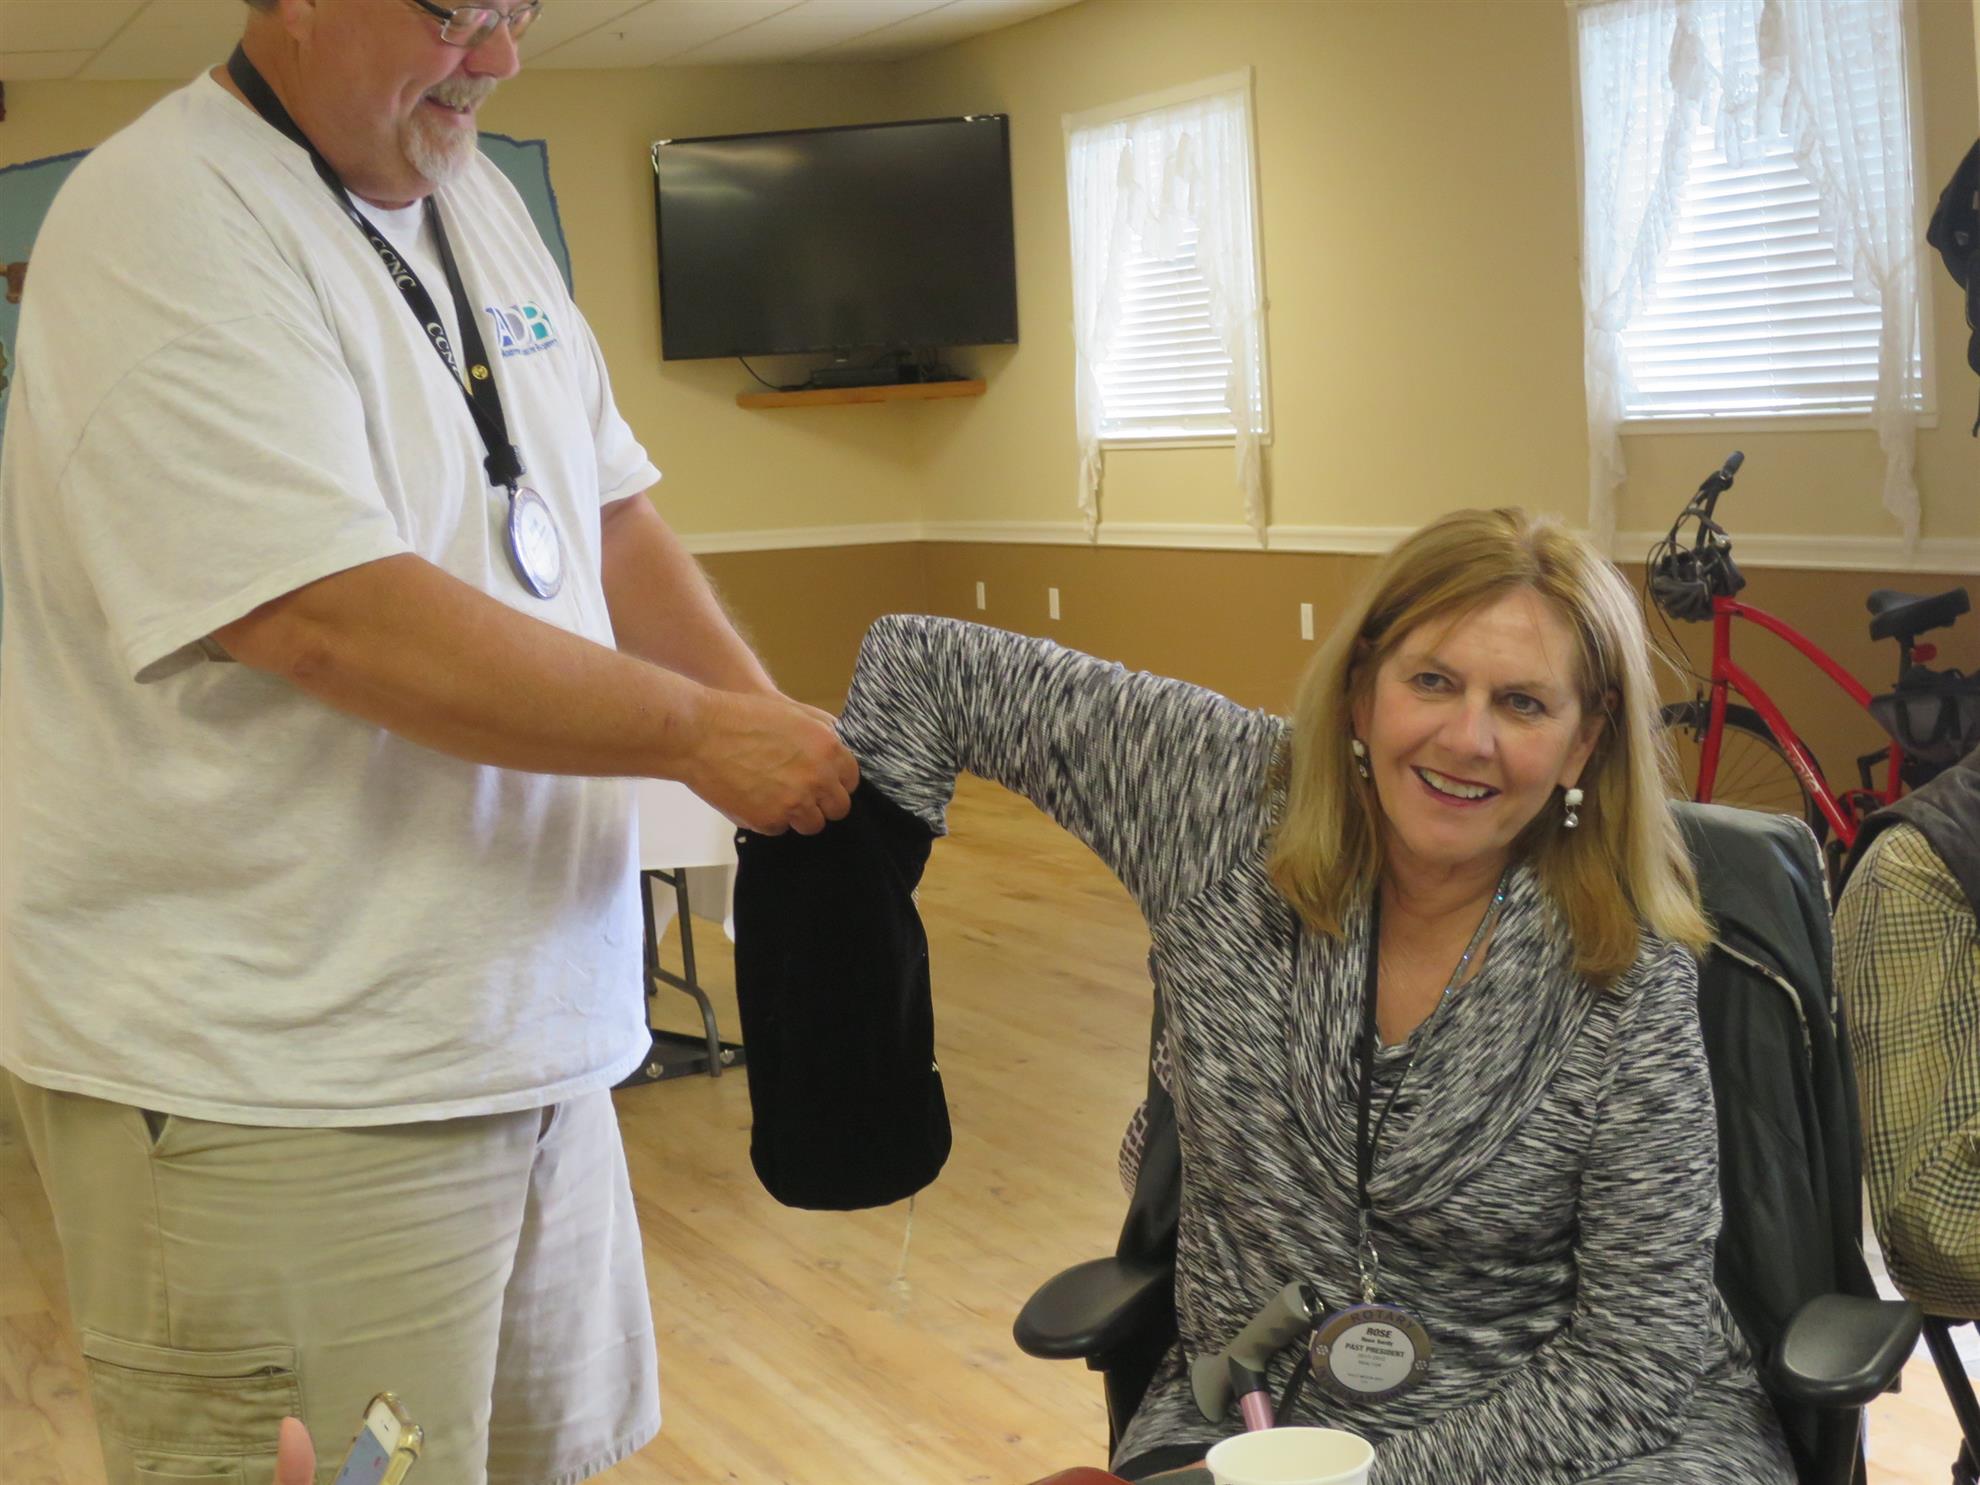
Ralph gets his winnings from a couple of weeks ago!
.JPG)
PHOTO GALLERY (no additional photos this week)